New York vs. Los Angeles, parcel by parcel
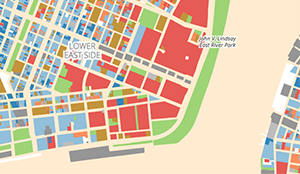
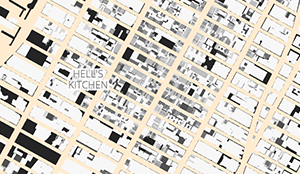
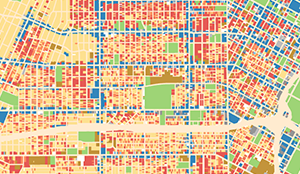
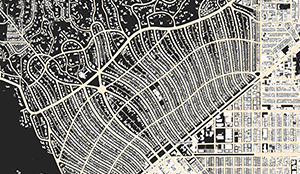
You might have been to the top of the Empire State Building, but this is a view you’ve never seen before: New York and L.A.’s neighborhoods, writ large. This map uses XYZ tools to tell the story of how New York City and Los Angeles were built, block by block and year by year. See how city planning patterns and trends shaped these two cities in sharply different ways.
Download links: New York buildings and parcels. Los Angeles buildings and parcels.
Source files and data can be accessed on GitHub.

This map was designed and built by Stamen Design with publicly available data.


