Tanks and Temples
Tank and Temples is a benchmark that uses Lidar point clouds as ground truth for benchmarking the quality of image-based 3-d reconstruction algorithms. The point clouds are stored as .ply files. Here we show how to load and visualize these point clouds.
Download Truck.ply (392 MB)
[link].
Import required Python packages. Here we use the plyfile Python package to read .ply files.
>>> import pptk
>>> import numpy as np
>>> import plyfile
Note
If pip install plyfile does not work,
simply save a local copy of plyfile.py from plyfile’s github page.
Read vertices in Truck.ply.
>>> data = plyfile.PlyData.read('Truck.ply')['vertex']
Use per-vertex attributes to make numpy arrays xyz, rgb, and n.
>>> xyz = np.c_[data['x'], data['y'], data['z']]
>>> rgb = np.c_[data['red'], data['green'], data['blue']]
>>> n = np.c_[data['nx'], data['ny'], data['nz']]
Visualize.
>>> v = pptk.viewer(xyz)
>>> v.attributes(rgb / 255., 0.5 * (1 + n))
Use [ and ] to toggle between attributes.
 |
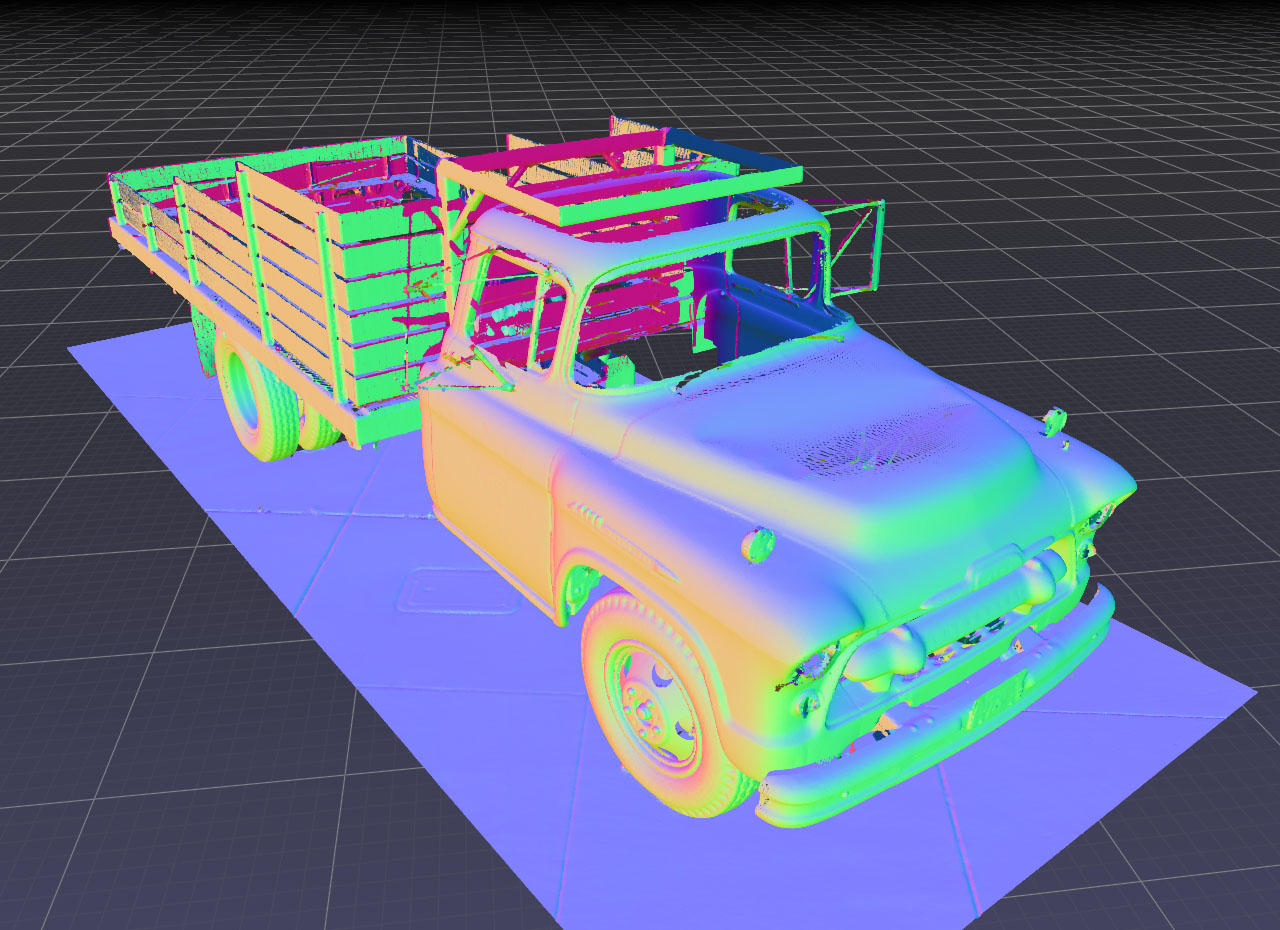 |
The Truck.py point cloud from Tanks and Temples
visualized using pptk.viewer(). Points are colored by RGB (left) and normal (right) |
The above procedure can be repeated for the other point clouds in the dataset.