U.S. building footprints dataset by Microsoft
Download the District of Columbia footprints from the project website.
Extract DistrictofColumbia.zip to get DistrictofColumbia.geojson.
In a Python terminal, import required Python packages.
Install any missing packages using pip install.
>>> import pptk
>>> import json
>>> import pyproj
>>> import numpy as np
Load DistrictofColumbia.geojson using json.load().
>>> with open('DistrictofColumbia.geojson', 'rb') as fd:
        data = json.load(fd)
Collect the polygon coordinates into a list of numpy arrays.
>>> Vs = [np.array(F['geometry']['coordinates'][0]) for F in data['features']]
Convert the points into UTM coordinates (District of Columbia’s UTM zone is 18).
>>> proj = pyproj.Proj(proj='utm', zone=18, ellps='WGS84')
>>> Ws = [np.c_[proj(V[:, 0].tolist(), V[:, 1].tolist())] for V in Vs]
Copy and paste the following function that converts a polygon into a point set.
def sample_polygon(V, eps=0.25):
    # samples polygon V s.t. consecutive samples are no greater than eps apart
    # assumes last vertex in V is a duplicate of the first
    M = np.ceil(np.sqrt(np.sum(np.diff(V, axis=0) ** 2, axis = 1)) / eps)
    Q = []
    for (m, v1, v2) in zip(M, V[: -1], V[1:]):
        Q.append(np.vstack([ \
            np.linspace(v1[0], v2[0], m, endpoint = False), \
            np.linspace(v1[1], v2[1], m, endpoint = False)]).T)
    Q = np.vstack(Q)
    return Q
Then apply sample_polygon() to all polygons in Ws and
concatenate the vertices into a single numpy array.
>>> P = np.vstack([sample_polygon(W) for W in Ws])
Add a third zero column.
>>> P = np.c_[P, np.zeros(len(P))]
Recenter the points to remove rendering glitches associated with rendering points with large coordinate values.
>>> P -= np.mean(P, axis=0)[None, :]
Visualize.
>>> v = pptk.viewer(P)
>>> v.set(point_size=0.1)
 |
 |
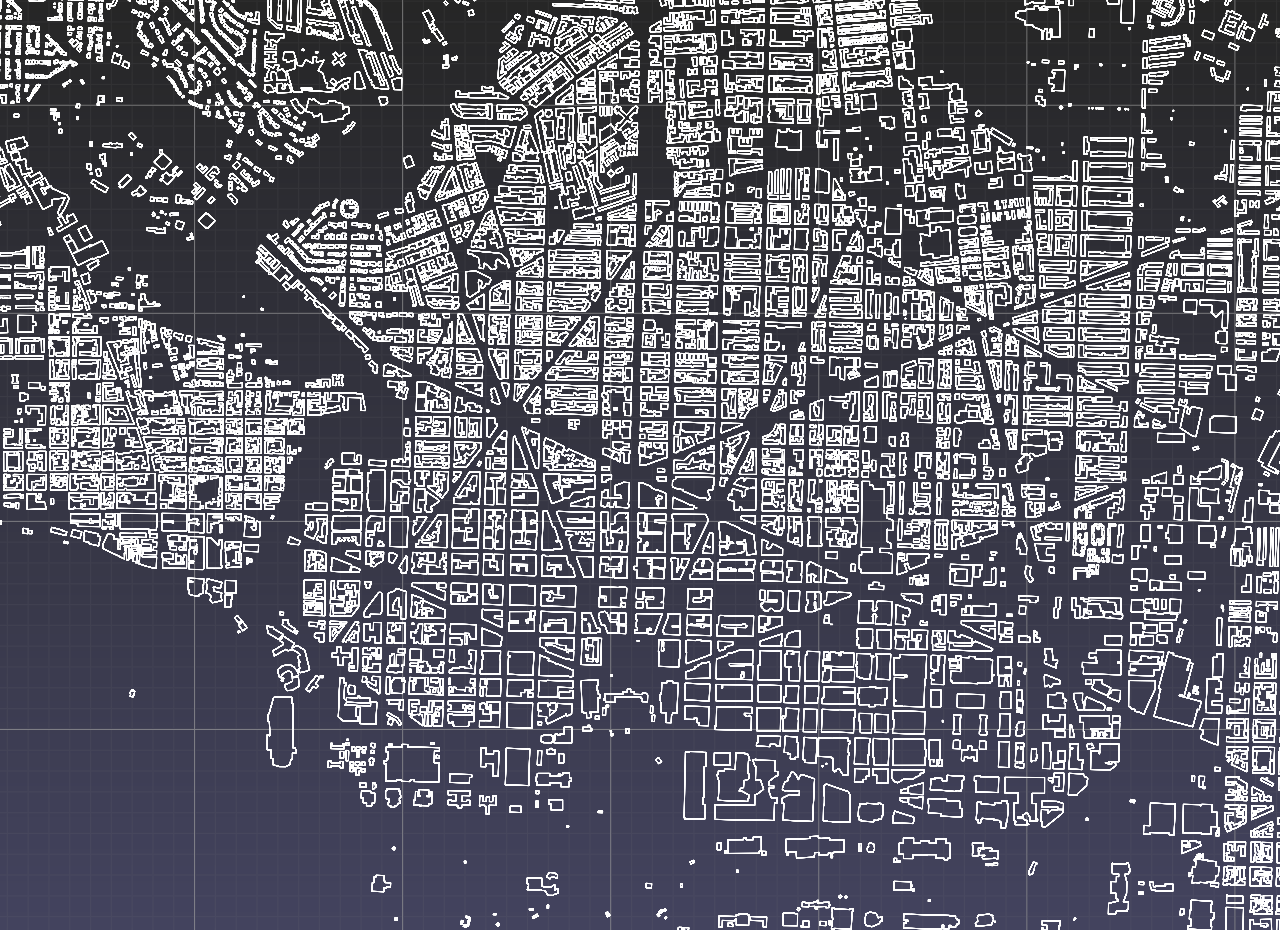
DistrictofColumbia.geojson polygons from Microsoft’s
US building footprints dataset
converted into a point set and viewed using pptk.viewer() |
The above procedure can be repeated for other .geojson files in the dataset. But note that converting polygons into a point set can become memory intensive. By the above procedure, the District of Columbia’s 58,329 polygons yields 18,465,292 points. This number of points is easily handled by pptk’s viewer, but the number of points may become prohibitive for larger .geojson files in the dataset. To visualize the larger .geojson files consider breaking them into smaller pieces.
Though programs such as QGIS may be more suitable for visualizing building footprints, especially if one needs to overlay the footprints on satellite imagery, pptk’s viewer can still at times be useful for quickly visualizing results of polygon calculations in Python.